Rotterdam-Rijnmond's emergency workers are always there for you!

Previous casestudy


Veiligheidsregio Rotterdam-Rijnmond

Facts and figures on earthquakes in Groningen

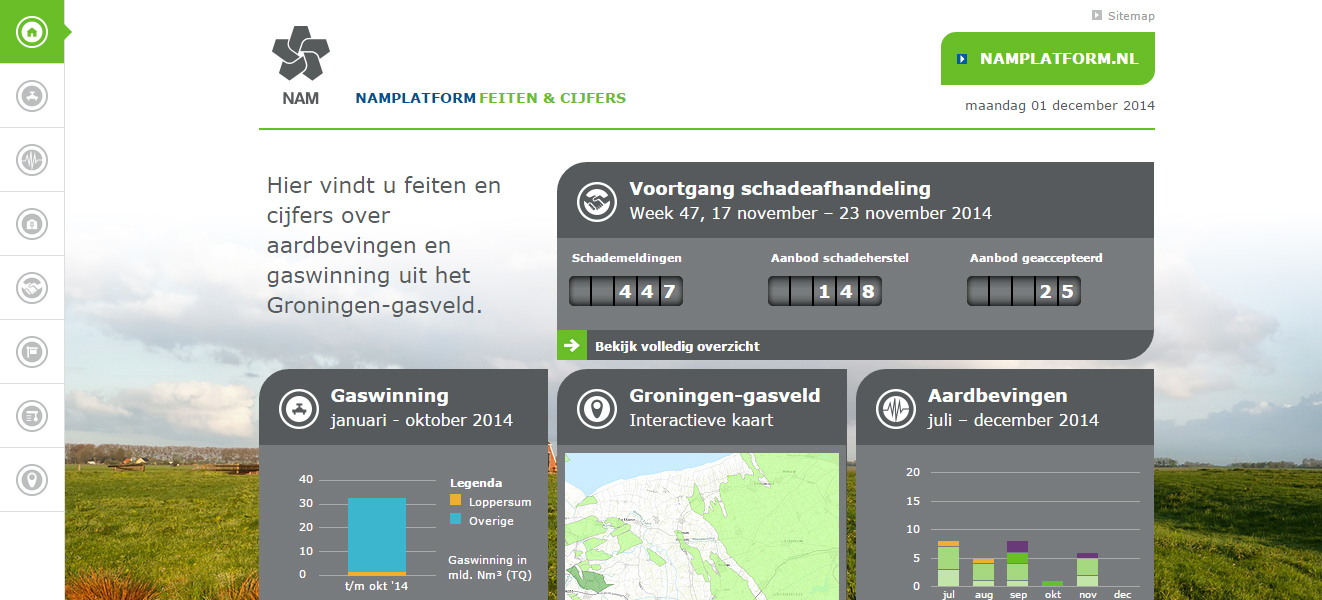
In Groningen, earthquakes are a sensitive subject. For this reason, a special website was developed to provide information about earthquakes, dialogue, claims adjustment, preventative measures and research: www.NAMplatform.nl.


One section of the online NAM platform is the Facts and Figures dashboard, which was developed by MCW.

Background


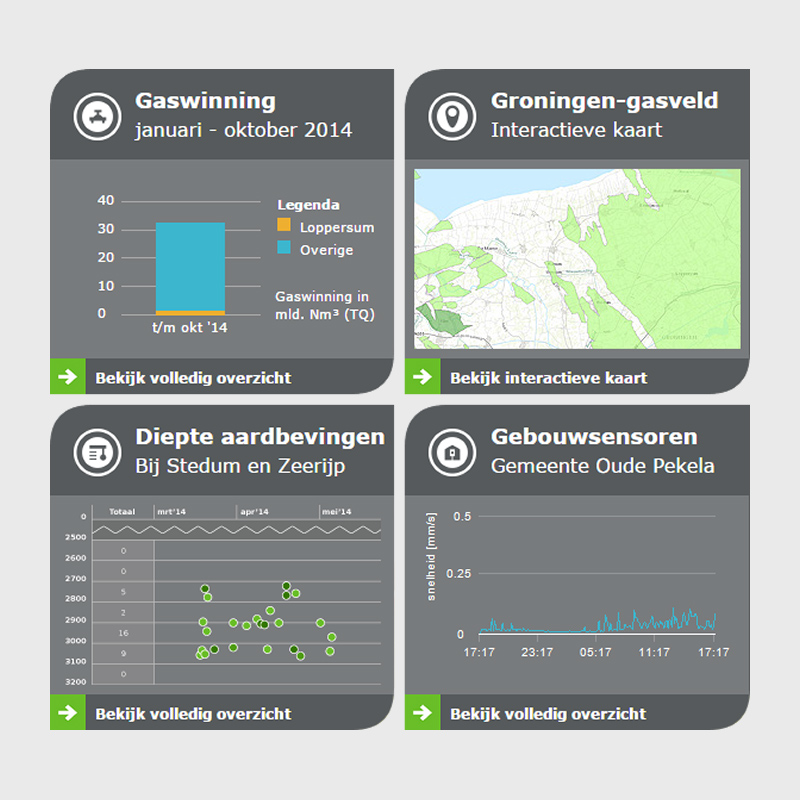
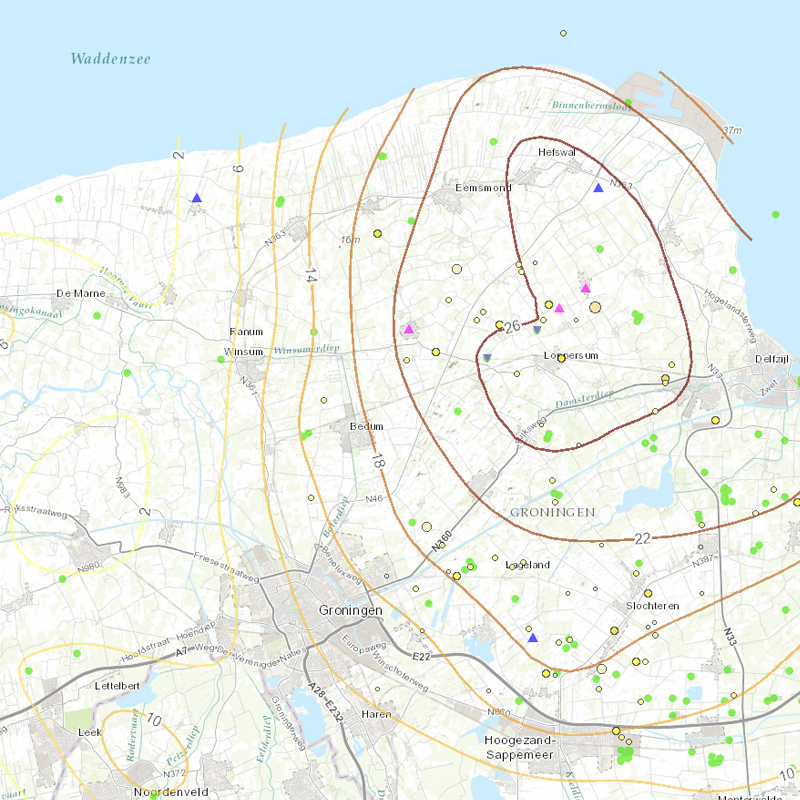
Although the Netherlands is never likely to suffer from earthquakes on a scale similar to the western US or Japan, the country does experience several dozen small earthquakes every year. In the north of the Netherlands, these tremors are induced, caused by extraction of natural gas in the region. These tremors can damage houses. If this happens, the Dutch oil company NAM provides compensation for the damage.

Although earthquakes are unpredictable - and unfortunately unavoidable in Groningen - NAM wishes to communicate as openly as possible about the issue. This involves separating facts from emotions and helping those affected as efficiently as possible.

The assignment


To develop an accessible online platform that the residents of Groningen can consult for up-to-date information about NAM gas extraction, earthquakes, claims adjustment and more.

Our approach


MCW began to develop the interactive Facts & Figures dashboard. As the name suggests, visitors can find NAM's latest production figures (relating to gas extraction) and up-to-date information about earthquakes. By combining statistics with a location plan, visitors to the website are given quick insight into relevant events.

A great deal of the data is available in real time. All information about ongoing damage claims are stored in a database. NAM has installed sensors in a variety of government buildings to measure any tremors that may occur. This real-time data formed the basis of our design.

The results


On the dashboard, visitors can view the progress of their claim and view an interactive map showing where the latest quakes took place. MCW realised the design and the real-time interface between the dashboard and the information available online. In this way, we were able to condense all of the facts and figures into an attractive and convenient platform.

MCW also produced a demonstration video that explains how the dashboard works.